Mobility and the Pandemic: Analysing the situation
11 June 2020
Photo di tomaskju from PxHere.
Since the COVID-19 emergency began, we have started to monitor the trend of Torino and Piemonte’s mobility through monitoring systems of the Mobility Centres we manage for the Municipality of Torino and the Piemonte Region.
Our goal is to understand and numerically quantify the effective impact of the national and regional restrictive measures issued for the containment of the spread of the pandemic, which has seriously limited the movements of citizens.
The methodological approaches outlined for the analysis are:
- geographical area under study: Torino (urban area, municipal borders) and Piemonte (regional borders)
- types of mobility considered: private transport (Torino and Piemonte), public transport (Torino), cycling mobility (Torino)
- analysis period: “normal” from 03/02/2020 to 23/02/2020 (taken as a reference point); «critical» from 24/02/2020 to 08/03/2020; «blocked» from 09/03/2020 to 29/03/2020
- list of the national and regional provisions adopted for the containment of the epidemic, specifically in terms of the restrictive measures pertaining to the movement of citizens and the closure of production activities deemed “not strictly necessary”
For every type of mobility, benchmark indicators were then identified and, for each of these, the variations and developments of the trends over time were calculated.
The traffic
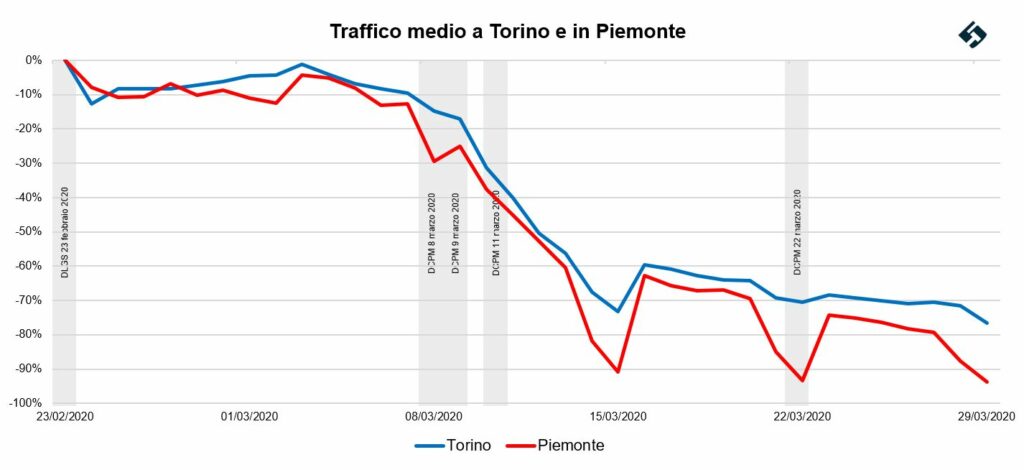
As a benchmark indicator, we selected average traffic, expressed in vehicles/days and collected information from the number of crossings registered on the traffic sensors of Torino and the Piemonte Region’s Mobility Centres. The data pertaining to the number of vehicle crossings was gathered thanks to the sensor network in Torino and Piemonte, which are connected and managed by our Centre. Its trend over time highlights the traffic changes on the urban and regional road network.
Compared to the period prior to the beginning of the emergency (the period between 3rd and 23rd February 2020), the traffic in Piedmont went down by 62% on workdays and 89% on weekends and holidays. Regarding Turin, traffic decreased by 60% on weekdays and 72% on weekends:
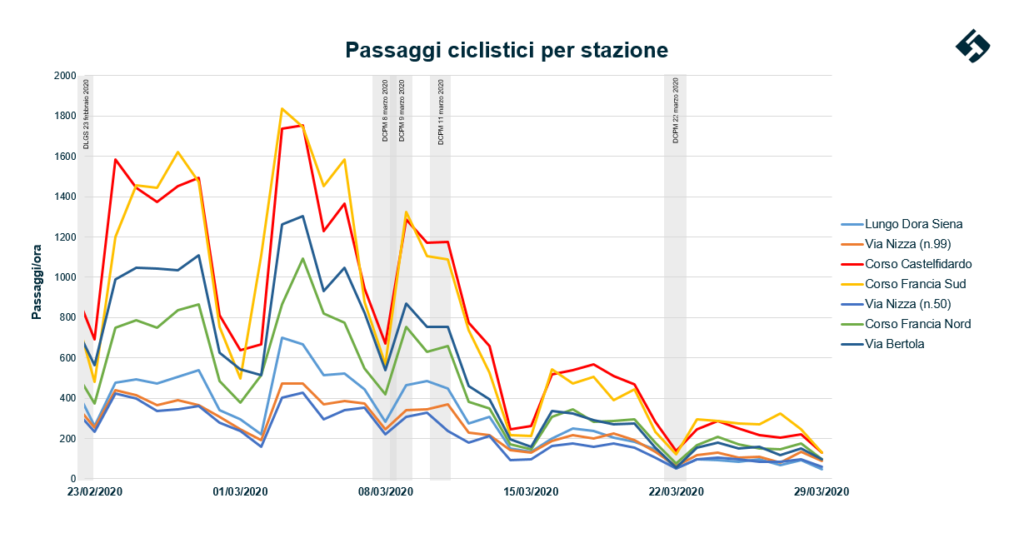
How about cycling mobility?
In order to understand how cycling movements changed during the months of lockdown, we analysed the data obtained from the sensor network installed on the main cycling trails in Torino and we chose ‘cycle flows’ as an indicator; this represents the number of daily crossings made by bicycle.
The “cycling” sensor network is made up of 6 measuring stations installed along the cycling paths of:
- Lungo Dora Siena
- Corso Francia Nord
- Corso Francia Sud
- Corso Castelfidardo
- Via Bertola
- Via Nizza
The monitoring activity of the cycling flows has been active in Turin for a year thanks to the National Operational Programme (PON) entitled “Metropolitan Cities”, whose financing has allowed the Municipality of Torino to identify dedicated reference points in synergy with the European project entitled Handshake.
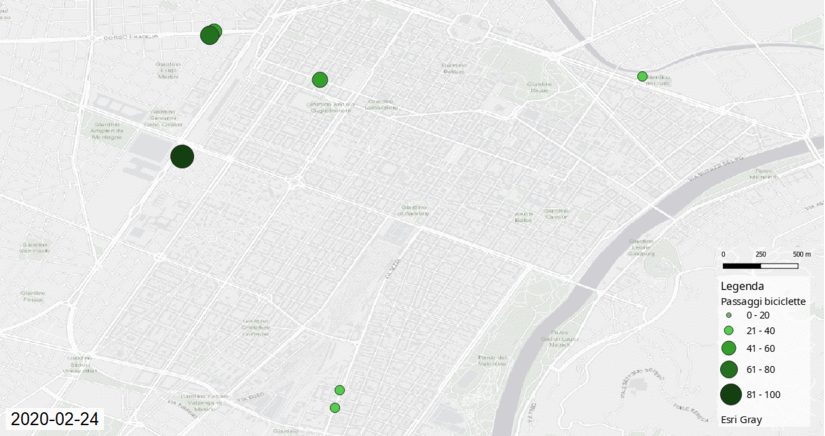
By looking at the graphs we created, the reduction in bicycle circulation is stark: on the one hand, the number of crossings per hour at each measuring station was significantly lower; on the other, there was a noticeable reduction of cycling flow per station for that specific period (Important: the representative data was then standardised, that is made independent from its reference units).
Finally, car parks and Limited Traffic Zones (Zona a Traffico Limitato – ZTL)
In Torino, there are 34 parking facilities or barrier parking areas distributed in the city. We analysed their records from 23rd February to 29th March 2020 and learned that the reductions were less dramatic compared to other types of data analysed: -44% on workdays and -35% on weekends and holidays. We asked ourselves why and one of the hypotheses we considered was the fact that many residents used the car parks to park their car, and that their cars had gone unused during the weeks of lockdown.
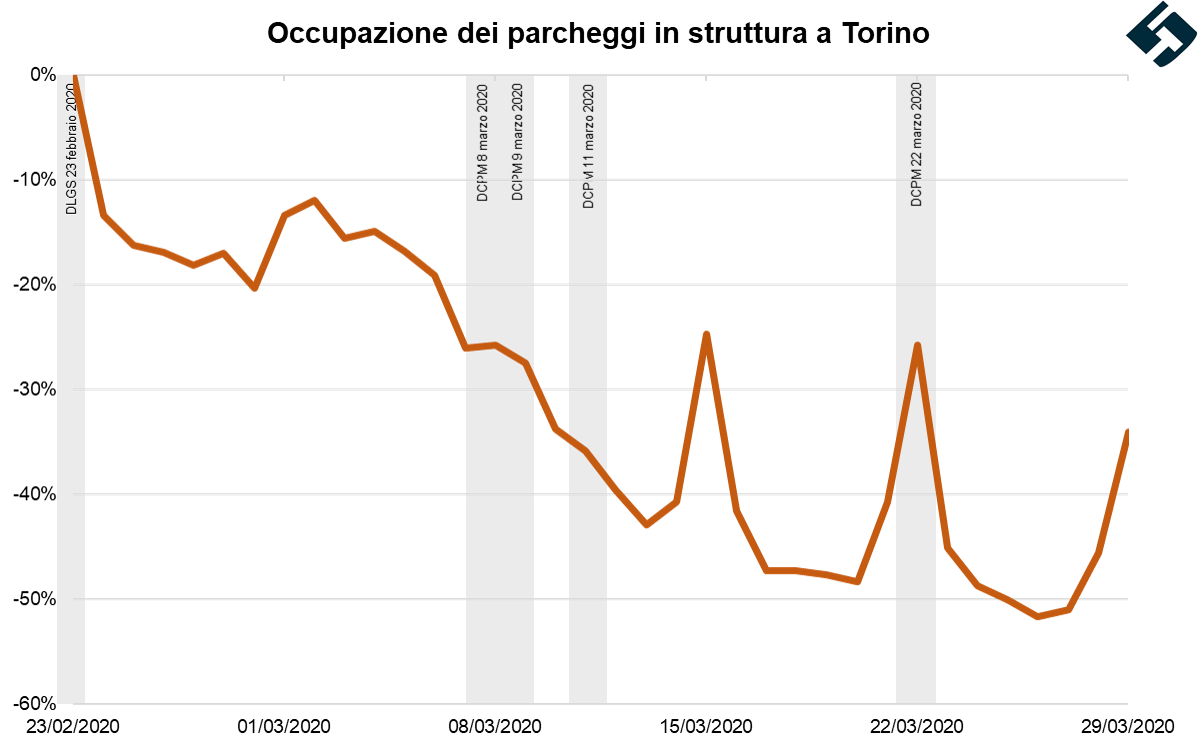
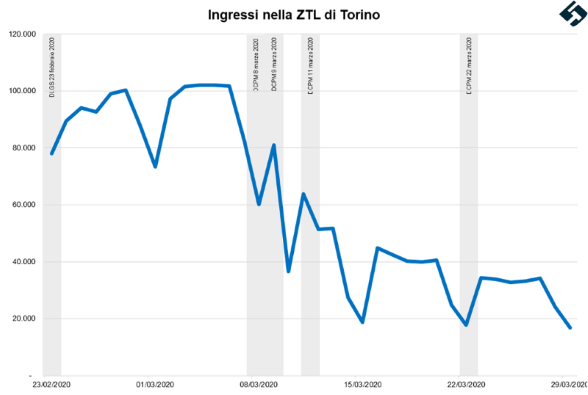
We regard to traffic in the ZTLs (Limited Traffic Zones), from 8th March, transit began to slow down constantly until 29th March 2020 with an average of -61% on workdays and -76% on weekends and holidays. Most public and private offices, cinemas, theatres and commercial businesses are located in Turin’s ZTL. Therefore, it is possible to hypothesize that the adoption of smart working on behalf of many companies may have impacted on workers’ movements during the week. While, at the weekend, the closure of commercial and cultural businesses impacted more significantly on weekend mobility. Lastly, the Municipality of Torino decided to suspend the ZTL (Limited Traffic Zones) from 13th March, with subsequent extensions.